Editor’s note: This article was first published in January 2013; its chart examples, including Banco Santander, Inditex, Bankia, Telefónica and the IBEX 35 double bottom around 5,900–6,000 points in summer 2012, reflect the market of late 2012. Banco Popular was later resolved and sold to Santander in 2017.
If I’m writing this article on technical analysis of stocks, it’s only because some readers have asked me to cover it. Personally, I’m one of those who think that in the long run all technical analysis is completely overridden by companies’ fundamentals and macroeconomic news.
Even so, it’s good to know the technical side, because even if you don’t believe in technical analysis, it is followed more and more by investors and above all by traders. What’s more, most trading platforms now have a chart-pattern scanner that alerts the investor when a pattern is forming. We are going to explain the basics of these chart patterns, not without first saying that they are only charts, and there are many more things that need to be analysed, such as trading volume, accumulation levels and so on, since that is what would validate the pattern in question. Let’s start with the first part.
1. Head and shoulders
This is one of the most bearish patterns there is. First there is a small rally (the shoulder) that loses strength and takes the stock lower. Then comes a very strong rally that forms an inverted “V”, taking the stock back down to the neckline. Once again it tries to climb, with a rise that lacks strength, and falls back. When this pattern forms, the stock ends up falling below that neckline, heralding a strong downtrend.
2. Inverse head and shoulders
Exactly the same pattern as the previous one, but upside down, and therefore heralding an uptrend after three attempts to fall.
3. Double top and triple top
A stock starts to rise and, at a certain level, stalls and begins to fall. Over time, the stock bounces again. The point where it stopped last time can be considered the first resistance level to beat. If the stock stops there again and can’t get past that level, it is confirmed as major resistance, since a double-top pattern has appeared. If it tries a third time and fails again, that would be a triple top, or what we could also call a real pain 🙂 To speak of a double or triple top, a certain amount of time has to pass. Let’s say a minimum of three weeks to confirm the difficulty. Banco Santander, for example, formed a double top, and a triple top almost formed; as it turned out, it didn’t happen, and the stock finally broke through that level on heavy volume, so the pattern was no longer valid.
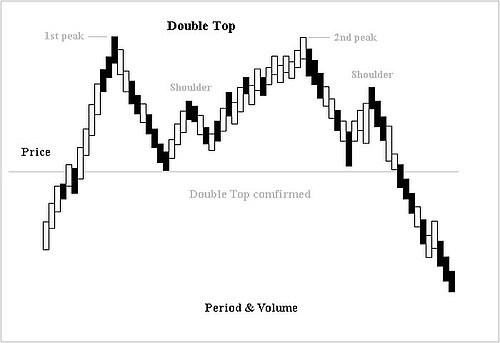
4. Double bottom or triple bottom
The same as the double and triple top, but the other way round. When we have a double bottom, that level becomes strong support. That was the pattern that supposedly sent the IBEX higher in the summer (the double bottom in the 6,000–5,900 point area). This pattern worked with the stocks we recommended a few months ago. If a stock marks a triple bottom, it is a sign that we can invest at that level with somewhat more peace of mind, since the support would be very solid. It is one of the clearest patterns and one that gives investors the most peace of mind when buying into a stock.
5. Rising, falling and sideways channels
A channel is the easiest pattern to spot. To give you an idea, Inditex is in a rising channel, Bankia in a falling channel, and Telefónica has been in a sideways channel for some time, until it finally seems to be trying to break out to the upside. To make our investment more effective, in a rising stock (inside a rising channel), if we want to buy into it, we would do so when the price is very close to the bottom of the channel, that is, close to the lower line of the channel.
A sideways channel can break either upwards or downwards, which is why we will also try to buy near the bottom of the channel. This gives us the chance to set a very tight stop-loss in case it finally breaks downwards. In a falling channel we simply wouldn’t buy, unless we were going short (a bearish position) or once it breaks out of the channel to the upside, as Banco Popular is trying to do right now.
So much for the simplest chart patterns. The second part, with the rest of the patterns, is available here: Chart patterns, part 2.