Editor’s note: This article was first published in April 2013 and later updated; its market comments on Sacyr, the S&P 500, the IBEX 35 and Facebook’s share price refer to 2013–2014 and are not current.
There are many technical indicators that can be used to try to predict whether shares are going to rise or fall. Will the stock break through resistance, hold support, continue its uptrend, or turn around and become a downtrend?
We all want to know, and the truth is that some indicators can help us find out, or at least give us some clues. No indicator is 100% effective on its own, but it’s true that sometimes, when several indicators give us the green light, the probability of getting it right goes up and the margin of error goes down.
That said, although most of these technical indicators are used for intraday trading, I find them much more useful for trend trading.
Which technical indicators are most used to predict share price movements?
We’d have…
- The moving average
- The MACD
- The RSI
- Trading volume
- The Aroon indicator
- Fibonacci retracement
1. The moving average
It’s the favourite indicator of many analysts, and some of them say it’s the most reliable. As a rule, if the share price holds above the moving average, there’s upside potential.
*The data and charts I’m going to use for the examples correspond to past dates and haven’t been updated, but they’re perfectly valid for explaining how the indicators work.
If there’s a close below the moving average, the technical picture gets complicated
In the Sacyr chart we can see something very recent: when I pointed out that Sacyr was about to take off, it was because the stock had bounced off the lower part of the channel it was tracing and had closed above the moving average.
A few hours later came the news that Sacyr’s chairman had sold his block of shares, and the technical picture was ruined. The stock then closed below the moving average, lost the lower part of the channel and accelerated its fall.
In this case, we have two indicators: a close below the moving average and a break of the lower part of the channel. However, in my own experience, the moving average is useless on its own, because it can make us miss important rallies and be slow to tell us we should get out of the stock (we’ll come back to Sacyr later).
Which type of moving average should you use?
The first step in deciding which moving average to use is to look at the history of the index or stock to see which one has worked in the past.
While the 200-session moving average has worked well for indices, for some stocks the 100-session moving average has worked better.
200-session moving average crossing the 50-session moving average
S&P 500 chart
In this chart we can see how the 200-session moving average has been acting as support for the 50-session moving average. In 2008, we can see what happens when the 50-session MA (blue) crosses below the 200-session MA (orange).
It triggered a very bearish trend in which the 200-session MA had now become resistance. (We can also read it as the 200-session average crossing above the 50-session average.)
Later, in mid-2009, we can see what happened when the blue line crossed the orange line on the way up, triggering the biggest bull market the S&P 500 has had in its entire history so far.
Now people are saying the S&P 500 is very overvalued and that the market has gone mad, because the trend, which is technically clearly bullish, doesn’t match the fundamentals of the companies, which are already starting to show signs of slowing in their results.
When will the severe correction we’re expecting come?
I’d venture to say as soon as the blue line crosses below the orange line again.
The 200-session moving average on its own
This chart shows the history of the IBEX 35, where we can see how the 200-session moving average has worked almost perfectly as both support and resistance for the index.
After a long uptrend, the IBEX 35 bumped into the 200-session MA several times, bouncing off it again and continuing its uptrend. After a feint below the MA at the end of 2007, it went back up.
Today we know that was a bear trap and a trick on the bulls who bought thinking the party would go on, although we can see what happened when the price finally fell below the 200-session MA, triggering a strong downtrend in which the average now acted as resistance.
When the price broke out upwards, there was a strong rebound. Between 2010 and mid-2011 the moving average stopped being reliable, but the MACD worked perfectly (of course, we only know that with hindsight).
The fact is that since the upward break in 2012, the 200-session MA has acted as support for the IBEX 35.
An example with Facebook
In the same way, we can see how a stock like Facebook began a big upward climb as soon as the moving averages crossed upwards (although it was accompanied by a series of positive news stories).
At the time this chart was made (2014), the 100-session moving average is acting as support for Facebook’s share price, a support that is now in danger and that would get technically worse as soon as the blue line crosses the orange line again.
Conclusions
Moving averages are fairly effective, though not free of false signals that could lead us into mistakes. We also need to bear in mind (as you’ll have noticed) that if we wait for the averages to cross, we can miss out on a large return, because they take time to cross once the shares have already started to pick up the trend.
For example, in the case of the IBEX 35, the index got as low as 5,900 points, while the entry signal, if we had followed this indicator alone, would have come at around 7,500 points. In other words, we’d have missed most of the party.
2. The MACD
The MACD is one of the indicators most used by experts, especially by traders. Let’s say it can warn us of the end of a trend and the start of a correction or a rebound.
To do this, this moving average convergence-divergence indicator uses two lines: the indicator line and its moving average (the signal line), and it’s when they cross that we get the signals to buy or sell the stock.
The truth is that in this Sacyr chart we can see how the MACD has worked perfectly. Every time the green line has crossed the black line, the trend has changed.
In theory, if we followed this indicator alone, we shouldn’t buy Sacyr until the lines cross again. However, we can see that Sacyr has support at around €1.22. If the lines cross near that level, we increase our chances of a successful entry.
Finally, of course, there’s the type of candle it has left us, which could signal exhaustion of the fall or be a neutral candle. That means that if the IBEX opened in positive territory tomorrow, Sacyr could rise, but if the IBEX keeps falling, Sacyr could lead the losses again.
The MACD has also worked perfectly with the IBEX 35, with the lines crossing during this period of volatility.
Most experts think the gains in the S&P 500 will continue because the lines still haven’t crossed, despite showing overbought conditions.
3. The RSI
For medium-term investing or for working out a trend, it tends to be one of the most reliable technical indicators (although not without lag). You have to use the RSI sensibly.
The RSI tells us that when it reaches 70, the stock is overbought and could therefore correct. Around 30 it’s oversold, so a rebound could come.
I’ve heard many experts say that with the RSI above 50 you should be bullish and can buy without fear. I’m more in favour of buying a stock even below 30.
If you manage to buy a stock when the RSI is around 20 or even lower, sooner or later, in 95% of cases, buyers end up coming in (always bearing in mind the type of stock we’re buying and assuming a normal situation).
As we can see in the IBEX 35 chart, at the end of January the RSI reached 70 and the IBEX corrected. In February it touched the 30 area and the IBEX rebounded.
Look where the RSI is now. In a normal market situation, with the candle it drew in the last session and with the RSI having turned up slightly near the 30 area, the IBEX would be bullish in the next session, even though it’s below the moving average.
Of course, as I said at the beginning, you have to use your head and take other indicators into account.
4. Trading volume
Trading volume can show us whether a stock has strength behind a rise or is running out of steam, so it can warn us that a change in trend is imminent.
Low trading volume during a fall can indicate that the stock is forming a bottom, while a sharp rise in trading can signal the start of a new trend.
Sometimes, the fact that a stock rises 15% doesn’t necessarily mean the rise is positive, because if trading volume has been very low, it may simply show that the price went up because of a squeeze in the stock.
That’s why less popular stocks are more volatile: they have low trading volume. To take one example, penny stocks can rise as much as 700% with only €300 traded (30,000 shares).
Now, if a stock rises strongly and the rise is accompanied by higher volume, the trend probably has strength, because it’s a serious rise.
Finding divergences in a stock
If we see an uptrend in the share price and a downtrend in trading volume, that’s known as a divergence. Some investors spend hours looking for these divergences, because spotting one can often let you anticipate what the stock is going to do, and so take advantage of the trend to make more money.
You need to understand both scenarios: for a stock to be considered in a “formal” uptrend, it must have more trading volume on the rises than on the falls, and conversely, in a downtrend, volume on the falls must be greater than on the rises. Otherwise there would be a divergence that would raise doubts and cancel out this indicator when it comes to making an investment decision.
It’s one more indicator for trying to gauge the strength of trends. If a rise has lower trading volume than the falls before it, the rise may not be healthy. The same goes for falls: if the share price drops on low volume, it may be a mere, insignificant correction.
5. The Aroon indicator
This indicator can help us identify the strength of a trend and the likelihood that the trend will continue. Investors usually look for a move above or below zero to try to determine whether a trend is under way.
The indicator is made up of two lines: “Aroon Up”, which measures the strength of an uptrend, and “Aroon Down”, which measures a downtrend.
A stock is considered to be in an uptrend when the Aroon Up line is above 70 and above the Aroon Down line.
Conversely, the stock is in a downtrend when Aroon Down is above 70 and above the Aroon Up line at the same time. Likewise, when both lines are close to each other and sit in a range between the 30 and 70 levels, the stock is said to be in a sideways trend, so there’s no clear trend.
Put more simply, a cross above zero indicates an uptrend, while a cross below zero indicates a downtrend.
The lines also warn us when a trend is weakening: when Aroon Up falls below the 50 level (the uptrend is weakening), or when Aroon Down falls below the 50 level (the downtrend is weakening).
6. Fibonacci retracement
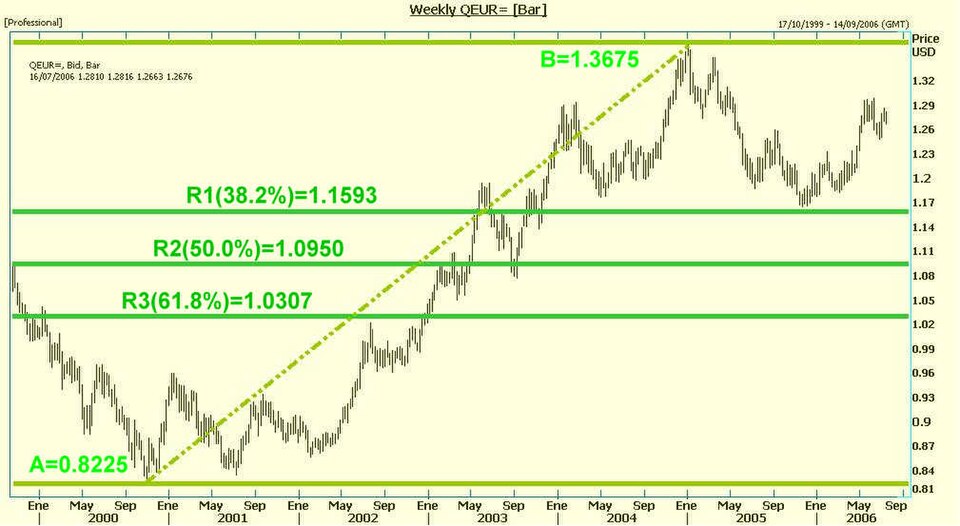
Although we’re not going to go into detail about the origin and meaning of Fibonacci numbers, they’re used to try to work out a possible support level for a stock where it’s likely to rebound.
After a large move, whether up or down, shares usually correct their price. Sometimes they correct by a small percentage before continuing their climb, and at other times the correction goes somewhat further.
Investors can use Fibonacci numbers to try to predict whether the stock is going to stop at a particular retracement level, finding support or resistance, and bounce (change trend).
Once the stock finds support on a Fibonacci line, the most likely outcome is that it resumes the trend it was following before the correction.
If, on the other hand, the stock doesn’t hold at that retracement level, the investor should wait for it at the next possible resistance or support level.
If the stock seems to be finding support at a level, and at the same time we have a green light from the Aroon indicator and volume backs up these two indicators, the chances of being wrong are quite low. And if we add the moving average on top of that and it also gives us the green light, we’d be looking at an optimal entry point.
Featured image: No machine-readable author provided. Leomty assumed (based on copyright claims), Public domain, via Wikimedia Commons.