Editor’s note: This article was first published in June 2013; all share prices, chart levels and indicator readings in this analysis are from 7 June 2013. Facebook, Inc. renamed itself Meta Platforms in 2021 and now trades as META. This is short-term trading analysis from June 2013, kept as a historical record. It is not investment advice.
After the sharp correction Facebook has gone through, from around $29 down to around $22.70, today the stock is rising, and on volume. The reason is that Morgan Stanley has reiterated its advice to use these pullbacks to buy. Morgan Stanley gives it a price target of $34, citing the company’s commitment to improving the experience for advertisers, and an increase in advertising revenue is starting to be forecast for the coming quarters.
In terms of the risk/reward equation, we have good momentum, since the stop-loss can be placed at $22.50 or $22, a little below yesterday’s lows. As for resistance, there could be a small one around $24.50/$24.70; if that is broken, the way would be practically clear up to $27/$28.
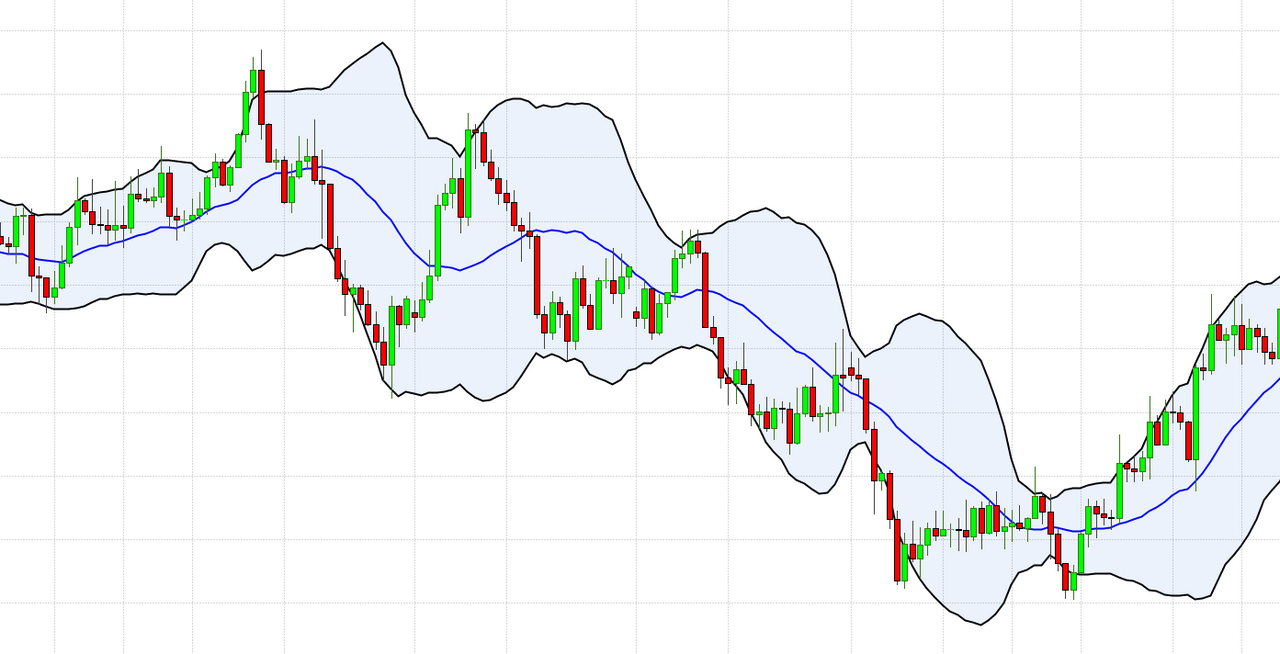
As for technical indicators, for fans of Bollinger Bands, Facebook has respected them precisely, so right now we are sitting right on the lower band.
The RSI shows the stock as oversold, while the MACD is not yet signalling a buy, although it could do so in the next few sessions.
Featured image: Albert Callisto, CC BY-SA 4.0, via Wikimedia Commons.