Some time ago we looked at one of the most widely used indicators for trend trading: the moving average. Although no indicator can predict with 100% accuracy whether a stock is going to rise or fall, by analysing and following several indicators at the same time we can at least make sure we are putting the odds in our favour.
When several indicators agree, it is time to take the risk. If we turn out to be wrong, all we should do is cut the loss as soon as possible.
There are three technical indicators that, used together, are very powerful for predicting a stock’s movement. Let’s say that when all three are green, the probability of getting it right is high, although there is always a margin of error.
The indicators we are talking about are as simple as volume, the Fibonacci retracement and the Aroon indicator.
Taken together, these three indicators can help us make a profitable investment, whether we are talking about short-term trading, weekly trading or a broader trend. They are ideal for giving us the right moment to enter. But I insist that there is always the risk of getting it wrong.
1. Volume
Trading volume can show us whether a stock’s rise has strength behind it or is running out of steam, and so it can warn us that a change in trend is imminent.
Low trading volume during a fall can indicate that the stock is bottoming out, while a sharp jump in trading can signal the start of a new trend.
Sometimes a stock rising 15% does not necessarily mean the rise is a positive sign: if trading volume was very low, it may simply show that the price went up because of a squeeze in the stock. That is why less popular stocks are more volatile, since they trade so little. To take one example, penny stocks can rise as much as 700% on just 300 euros of trading (30,000 shares).
However, if a stock rises strongly and the rise comes with an increase in volume, the trend probably has strength, because it is a serious rise.
But you have to understand both scenarios. For a stock to be considered in a “proper” uptrend, it must trade more volume on the way up than on the way down; conversely, in a downtrend, volume on the falls must be higher than on the rises. Otherwise there would be a divergence that would raise doubts and cancel out this indicator when making an investment decision.
2. The Aroon indicator
This indicator can help us identify the strength of a trend and the likelihood that the trend will continue. Investors usually look for a move above or below zero to try to determine whether a trend is under way.
The indicator is made up of two lines: “Aroon Up”, which measures the strength of an uptrend, and “Aroon Down”, which measures a downtrend.
A stock is considered to be in an uptrend when the Aroon Up line is above 70 and above the Aroon Down line. Conversely, the stock is in a downtrend when Aroon Down is above 70 and above the Aroon Up line at the same time. And when the two lines are close to each other and sit in a range between 30 and 70, the stock is said to be moving sideways, so there is no clear trend.
Put more simply, a cross above zero indicates an uptrend, while a cross below zero indicates a downtrend.
The indicator also warns us when a trend is weakening: when Aroon Up falls below 50 (the uptrend is weakening), or when Aroon Down falls below 50 (the downtrend is weakening).
3. The Fibonacci retracement
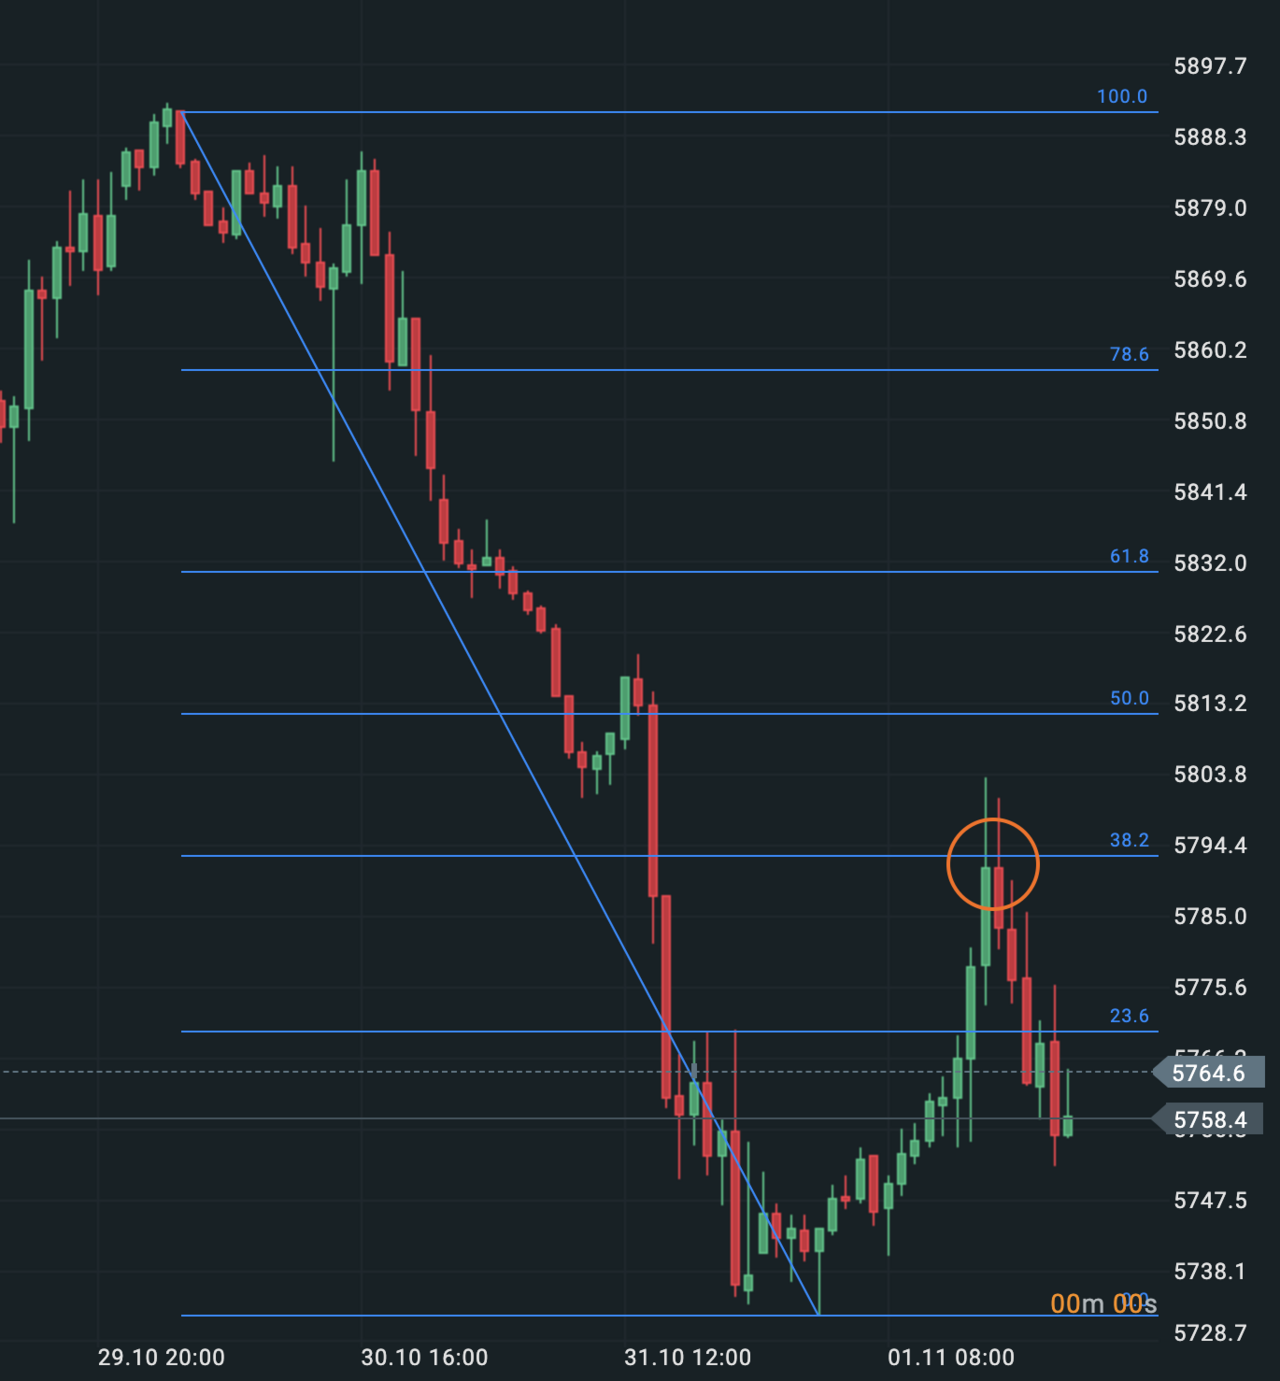
Without going into detail about the origin and meaning of the Fibonacci numbers, they are used to try to work out a possible support level for a stock, where the price is likely to bounce.
After a large move, whether up or down, stocks usually correct. Sometimes they correct by a small percentage before continuing their climb, and at other times the correction goes a little further.
Investors can use the Fibonacci numbers to try to predict whether a stock is going to stop at a particular retracement level, finding support or resistance there and bouncing (changing direction). Once the stock finds support at a Fibonacci line, it will most likely resume the trend it was following before the correction.
If, on the other hand, the stock does not hold at that retracement level, the investor should wait for it at the next possible level of support or resistance.
If the stock looks as though it is finding support at a level, and at the same time we have a green light from the Aroon indicator and volume backs up these two indicators, the truth is that the chances of being wrong are quite low. And if, on top of that, we add the moving average and it also gives us the green light, we would be looking at an optimal entry point.
See also: Chart patterns: the minimum technical analysis every investor should know
Featured image: Profesor von Bohemia, CC0 1.0, via Wikimedia Commons.