Editor’s note: This article was first published in September 2021, and its valuation indicators, house price figures and risks are a snapshot of markets at that time. Its forecast of a 20–40% stock market fall between December 2021 and February 2022 has expired; US stocks fell sharply during 2022.
High stock market valuations leave no room for doubt. We are in an advanced phase of a financial bubble, as the many indicators and ratios that measure these valuations show. Moreover, the bubble is not only in the stock market: as we show below, the housing market has also reached a level similar to that of the 2006–2008 housing crisis.
We also see many similarities with previous crises, such as the arrival of new investment products, among them SPACs and cryptocurrencies.
History repeats itself because human beings repeat exactly the same behaviour as in the past. We will always hear people say that this time is different, that it’s not the same. Those words were heard during the tech bubble of the 1990s. And I imagine they were also heard during the South Sea Bubble, to say it was different from tulip mania.
If we are not mistaken and the bigger problem we foresee for the US Federal Reserve does materialise, the stock market could fall by between 20 and 40 percent, which could trigger the great financial crisis that is expected between December 2021 and February 2022. Or perhaps it will just turn out to be one of the many sharp corrections the stock market goes through.
See also: Don’t ignore the role of luck and randomness in stock market investing
What we can’t ignore is that the 4 stages or phases of a financial bubble are playing out, and we may well be in the manic phase (the last one).
A stock market bubble: are shares expensive?
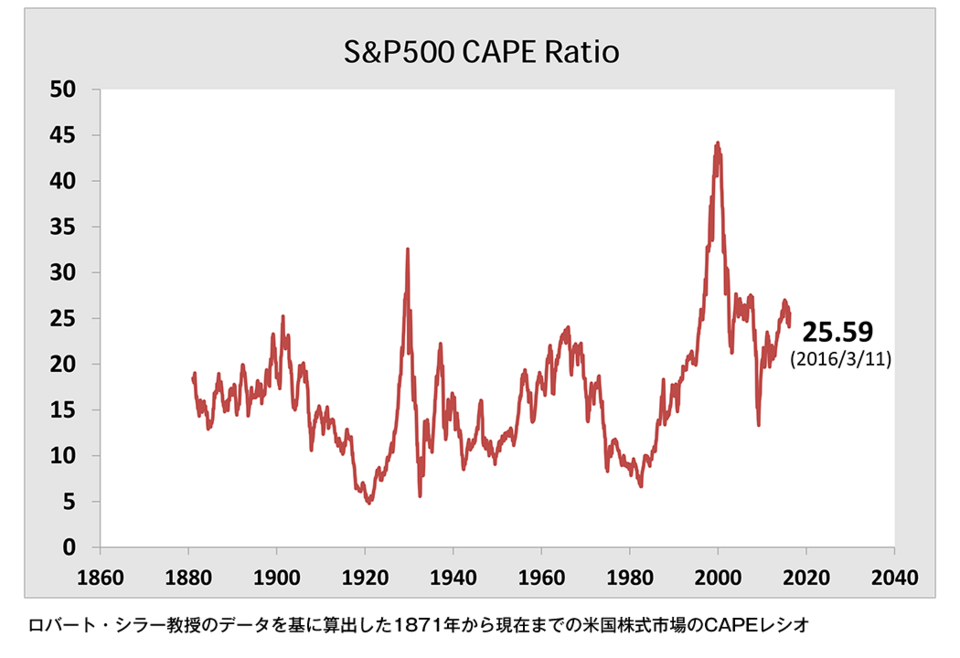
If we follow the Shiller index, we can see that right now we are above other financial crises and reaching a level similar to the dot-com crisis.
The Shiller P/E ratio for the S&P 500
The Shiller P/E ratio for the S&P 500 measures the price-to-earnings ratio of the companies in the index. It is one of the most widely used ratios for deciding whether shares are expensive or cheap.
To give you an idea, the average for a stable market would be around 15 or 16. Right now the ratio is close to 40, which indicates that the market is overvalued.
The Buffett indicator
In Warren Buffett’s own words, if this ratio approaches 200%, you are playing with fire. Right now we are above 220%, so we have been getting burned for quite a while.
What the Buffett indicator measures
The Buffett index or indicator measures the ratio between the total value of the stock market and GDP, and it is considered one of the best measures at any given moment for finding out whether the market is expensive or cheap.
Is there a bubble in the housing market?
This ratio measures the relationship between house prices and average household income in the United States.
Historically, an average house in the US cost around 5 times annual household income. During the 2006 housing bubble the ratio went above 7; in other words, an average single-family home in the United States cost more than 7 times the average annual household income in the US.
Even house prices relative to income are now at the same level as before the 2008 housing bubble burst. And this is not just happening in the United States: if we look at the United Kingdom, the situation is exactly the same.
John Paulson’s advice for property investors
Despite this situation, which should be recognised by now because it follows past patterns, house prices have kept rising by as much as 20%. In fact, the billionaire John Paulson recommends that investors keep investing in the housing market, because prices will keep going up.
He even advised investors that if they have 100,000 dollars, they should buy a house for 1 million dollars, using the 100,000 as a down payment. Since house prices are expected to rise by 20%, they would have made 200,000 dollars on an investment of just 100,000.
The Fed’s usual recipe for dealing with economic disasters is to cut interest rates and provide monetary stimulus by printing money. This is not sustainable over time, and markets only need a mouse to frighten the elephant, or rather, the match that sets fire to the petrol already spilled.
That match or that mouse could be a little more inflation, a rise in interest rates, the withdrawal of monetary stimulus, vaccines failing to contain the virus, or a new variant of the virus.
See also: Seth Klarman’s advice for investors in today’s market is worth taking seriously
In any case, there are too many dangers in this market, which is clearly caught up in a huge bubble. When this bubble will burst and give way to a financial crisis is something no one can know for sure.
See also: The best stock market and finance books for learning to invest
Featured image: 耳亜子, CC BY-SA 4.0, via Wikimedia Commons.