Editor’s note: This article was first published in October 2013. Ariad’s one-day fall of about 66% and all prices, changes, market caps, P/E ratios and revenue figures in the tables are from 9 October 2013; several listed companies have since been acquired, renamed or delisted. This October 2013 market comment is kept as a historical record. It is not investment advice.
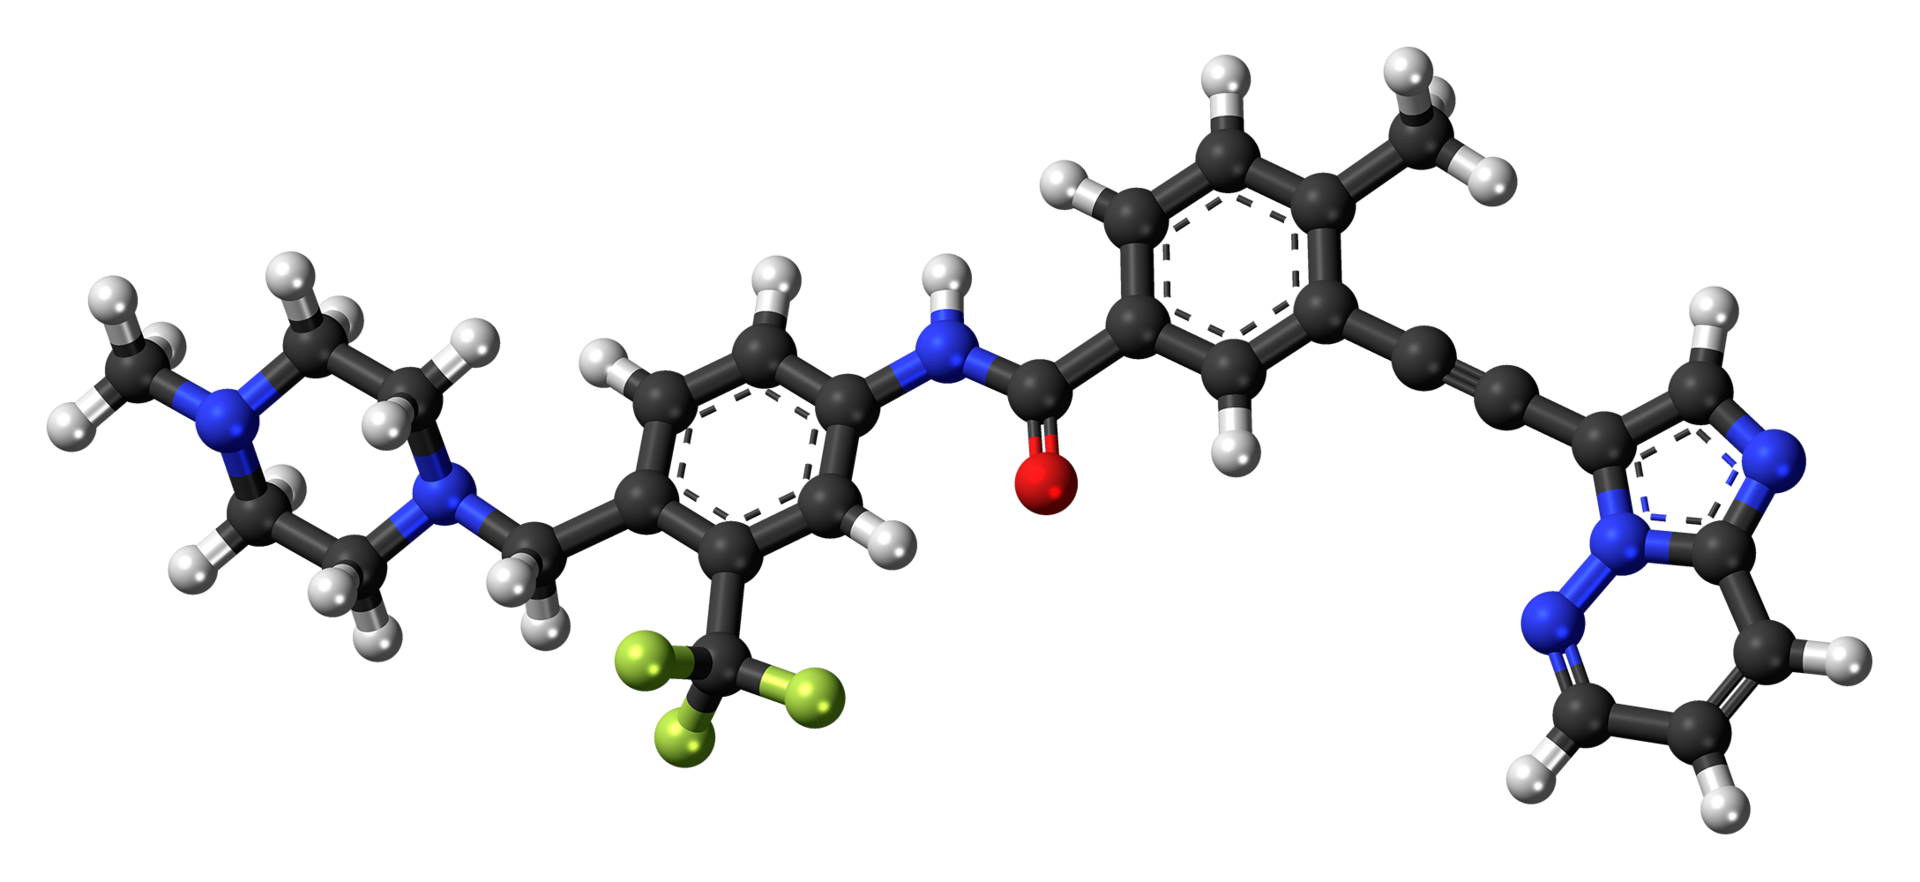
Almost without exception, Wall Street’s pharmaceutical stocks are sinking these days. The main protagonist is Ariad Pharmaceuticals, whose leukemia drug has run into problems in patients. The authorities have taken temporary measures, while the number of patients with heart problems after receiving the treatment keeps rising.
For those who were looking to add shares of the world’s leading pharmaceutical companies to their portfolios, after this stock market massacre, now in its second day, this may be the moment to pick some, while remembering that the outlook for the US market may not be very good in the medium term.
Acadia is another pharmaceutical company that, after gaining more than 1,000% so far this year, has begun a spectacular fall that has taken it from $30 to $19 in just five sessions.
The pharmaceutical stocks that fell the most today:
| Company | Quote | Change | Change % | Market cap | P/E (ttm) | Ann. revenue | Ann. net income |
|---|---|---|---|---|---|---|---|
| Ariad Pharmaceuticals, Inc. | 5.83 | -11.31 | -65.99 | 1.08B | – | 0.56 | -220.87 |
| CytRx Corporation | 2.23 | -0.51 | -18.61 | 67.99M | – | 0.10 | -17.96 |
| Cancer Genetics Inc | 15.39 | -3.36 | -17.92 | 89.52M | – | 4.30 | -6.67 |
| BG Medicine, Inc. | 0.616 | -0.127 | -17.13 | 17.21M | – | 2.82 | -23.77 |
| Puma Biotechnology Inc | 40.52 | -7.64 | -15.86 | 1.16B | – | – | -74.35 |
| Fate Therapeutics Inc | 6.70 | -1.24 | -15.62 | 127.64M | – | 2.67 | -14.24 |
| Lpath, Inc. | 4.12 | -0.76 | -15.57 | 54.16M | – | 6.69 | -2.75 |
| China Pharma Holdings, Inc. | 0.260 | -0.047 | -15.41 | 11.34M | – | 54.51 | 4.62 |
| ACADIA Pharmaceuticals Inc. | 19.86 | -3.44 | -14.76 | 1.76B | – | 4.91 | -20.85 |
| Acceleron Pharma Inc | 19.98 | -3.22 | -13.88 | 513.60M | – | 15.25 | -59.64 |
| Atossa Genetics Inc | 2.12 | -0.33 | -13.47 | 33.03M | – | 0.48 | -5.08 |
| Agios Pharmaceuticals Inc | 25.15 | -3.82 | -13.19 | 781.52M | – | 25.11 | -27.29 |
| Tekmira Pharmaceuticals Corporation | 8.77 | -1.31 | -13.00 | 146.43M | 4.47 | – | – |
| Chimerix Inc | 16.07 | -2.37 | -12.85 | 414.29M | – | 33.72 | -8.76 |
| Sarepta Therapeutics Inc | 44.42 | -5.63 | -11.25 | 1.49B | – | 37.33 | -121.29 |
| Aastrom Biosciences Inc | 0.224 | -0.028 | -11.25 | 16.96M | – | 0.02 | -33.47 |
| Celldex Therapeutics, Inc. | 25.70 | -3.25 | -11.23 | 2.08B | – | 11.20 | -59.12 |
| Insmed Incorporated | 12.32 | -1.55 | -11.18 | 479.67M | – | 0.00 | -41.37 |
| Achillion Pharmaceuticals, Inc. | 2.43 | -0.31 | -11.13 | 235.32M | – | 2.61 | -47.13 |
| Retractable Technologies, Inc. | 2.85 | -0.35 | -10.94 | 76.27M | – | 33.64 | -5.05 |
Source: Google Finance
The healthcare companies that have performed best these days:
| Company | Quote | Change | Change % | Market cap | P/E (ttm) | Ann. revenue | Ann. net income |
|---|---|---|---|---|---|---|---|
| LDR Holding Corp | 19.35 | +4.35 | 29.00 | – | – | 0.00 | – |
| Neuralstem, Inc. | 2.50 | +0.29 | 13.12 | 179.12M | – | 0.41 | -10.12 |
| BSD Medical Corporation | 1.42 | +0.14 | 10.94 | 48.25M | – | 2.07 | -7.96 |
| CAS Medical Systems Inc | 1.43 | +0.12 | 9.16 | 27.09M | – | 22.67 | -8.43 |
| Echo Therapeutics Inc | 2.67 | +0.19 | 7.66 | 36.55M | – | 0.01 | -12.33 |
| Baxano Surgical Inc | 1.39 | +0.09 | 6.92 | 62.82M | – | 14.57 | -29.89 |
| Oramed Pharmaceuticals, Inc. | 6.64 | +0.42 | 6.75 | 52.46M | – | – | -3.34 |
| Arrowhead Research Corp | 7.23 | +0.41 | 6.01 | 228.03M | – | 0.15 | -21.13 |
| XTL Biopharmaceuticals Ltd. (ADR) | 5.49 | +0.31 | 5.98 | 62.99M | – | 0.94 | -1.39 |
| Alphatec Holdings Inc | 2.04 | +0.11 | 5.70 | 198.08M | – | 196.28 | -15.46 |
| Lannett Company, Inc. | 17.96 | +0.96 | 5.65 | 518.12M | 39.13 | 151.05 | 13.32 |
| Insys Therapeutics Inc | 43.94 | +2.31 | 5.55 | 940.62M | – | 15.48 | -2.06 |
| IMRIS Inc | 1.74 | +0.09 | 5.45 | 85.85M | – | – | – |
| IGI Laboratories, Inc. | 1.95 | +0.10 | 5.41 | 84.34M | – | 8.56 | -3.93 |
| Cell Therapeutics Inc | 1.86 | +0.09 | 5.08 | 213.48M | – | 0.00 | -115.28 |
| Uroplasty, Inc. | 3.30 | +0.15 | 4.76 | 70.35M | – | 22.42 | -3.31 |
| Compugen Ltd. (USA) | 9.85 | +0.43 | 4.56 | 360.42M | – | 0.24 | -13.63 |
| Bioline RX Ltd | 2.92 | +0.12 | 4.29 | 66.05M | – | – | – |
| Hologic, Inc. | 21.51 | +0.86 | 4.16 | 5.82B | – | 2,002.65 | -73.63 |
| Arrhythmia Research Technology, Inc. | 3.05 | +0.12 | 4.10 | 8.25M | – | 20.64 | -2.38 |
Source: Google Finance
Featured image: Jynto ( more from this user ), CC0 1.0, via Wikimedia Commons.