
VIX

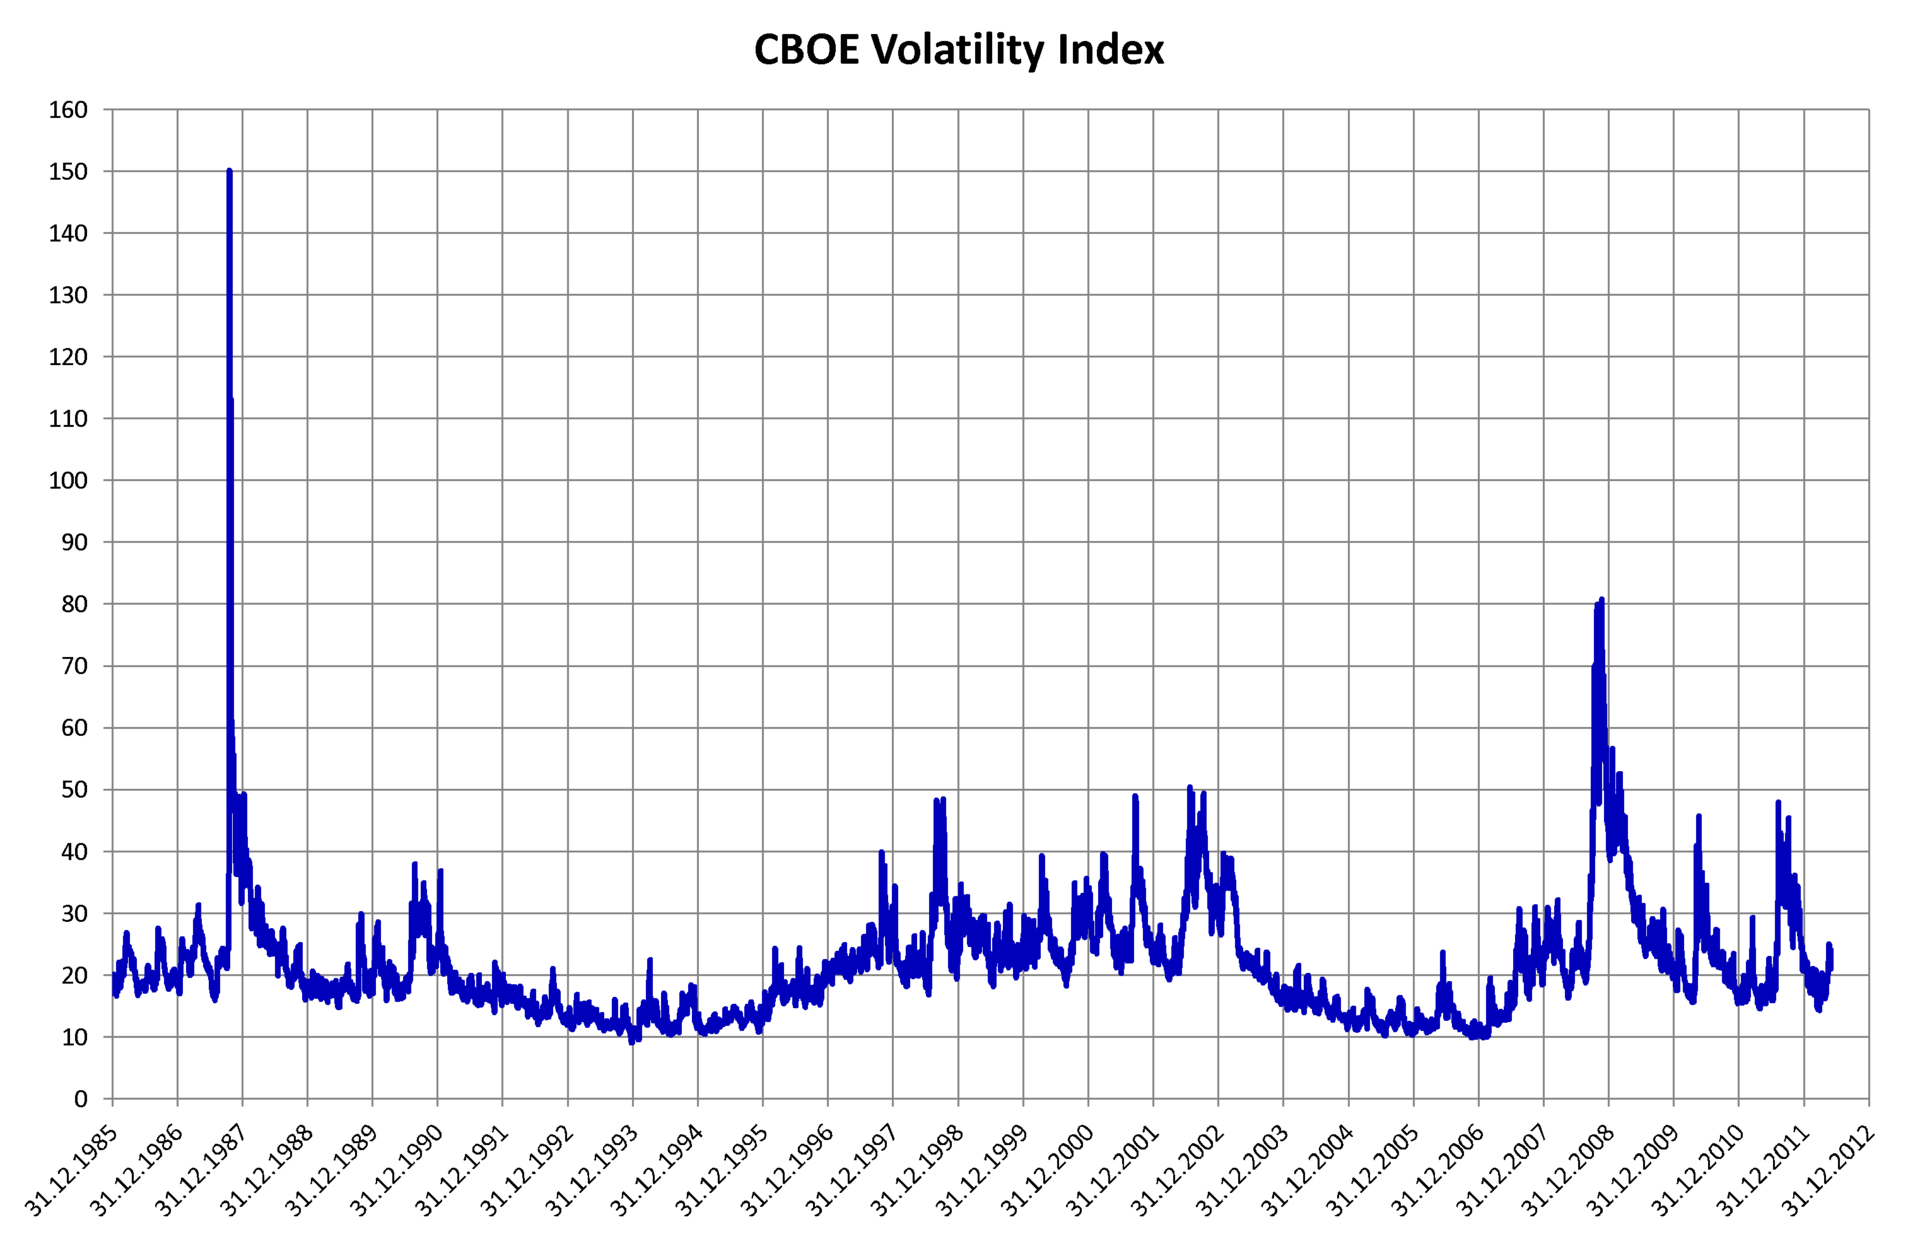
Line chart of the CBOE Volatility Index from 1985 to 2012, with sharp spikes in 1987 and late 2008
Fear index, fashion trends and burgers: silly economic indicators to watchInvesting

Fear index, fashion trends and burgers: silly economic indicators to watch
Rosella C.Rosella C.July 1, 2014
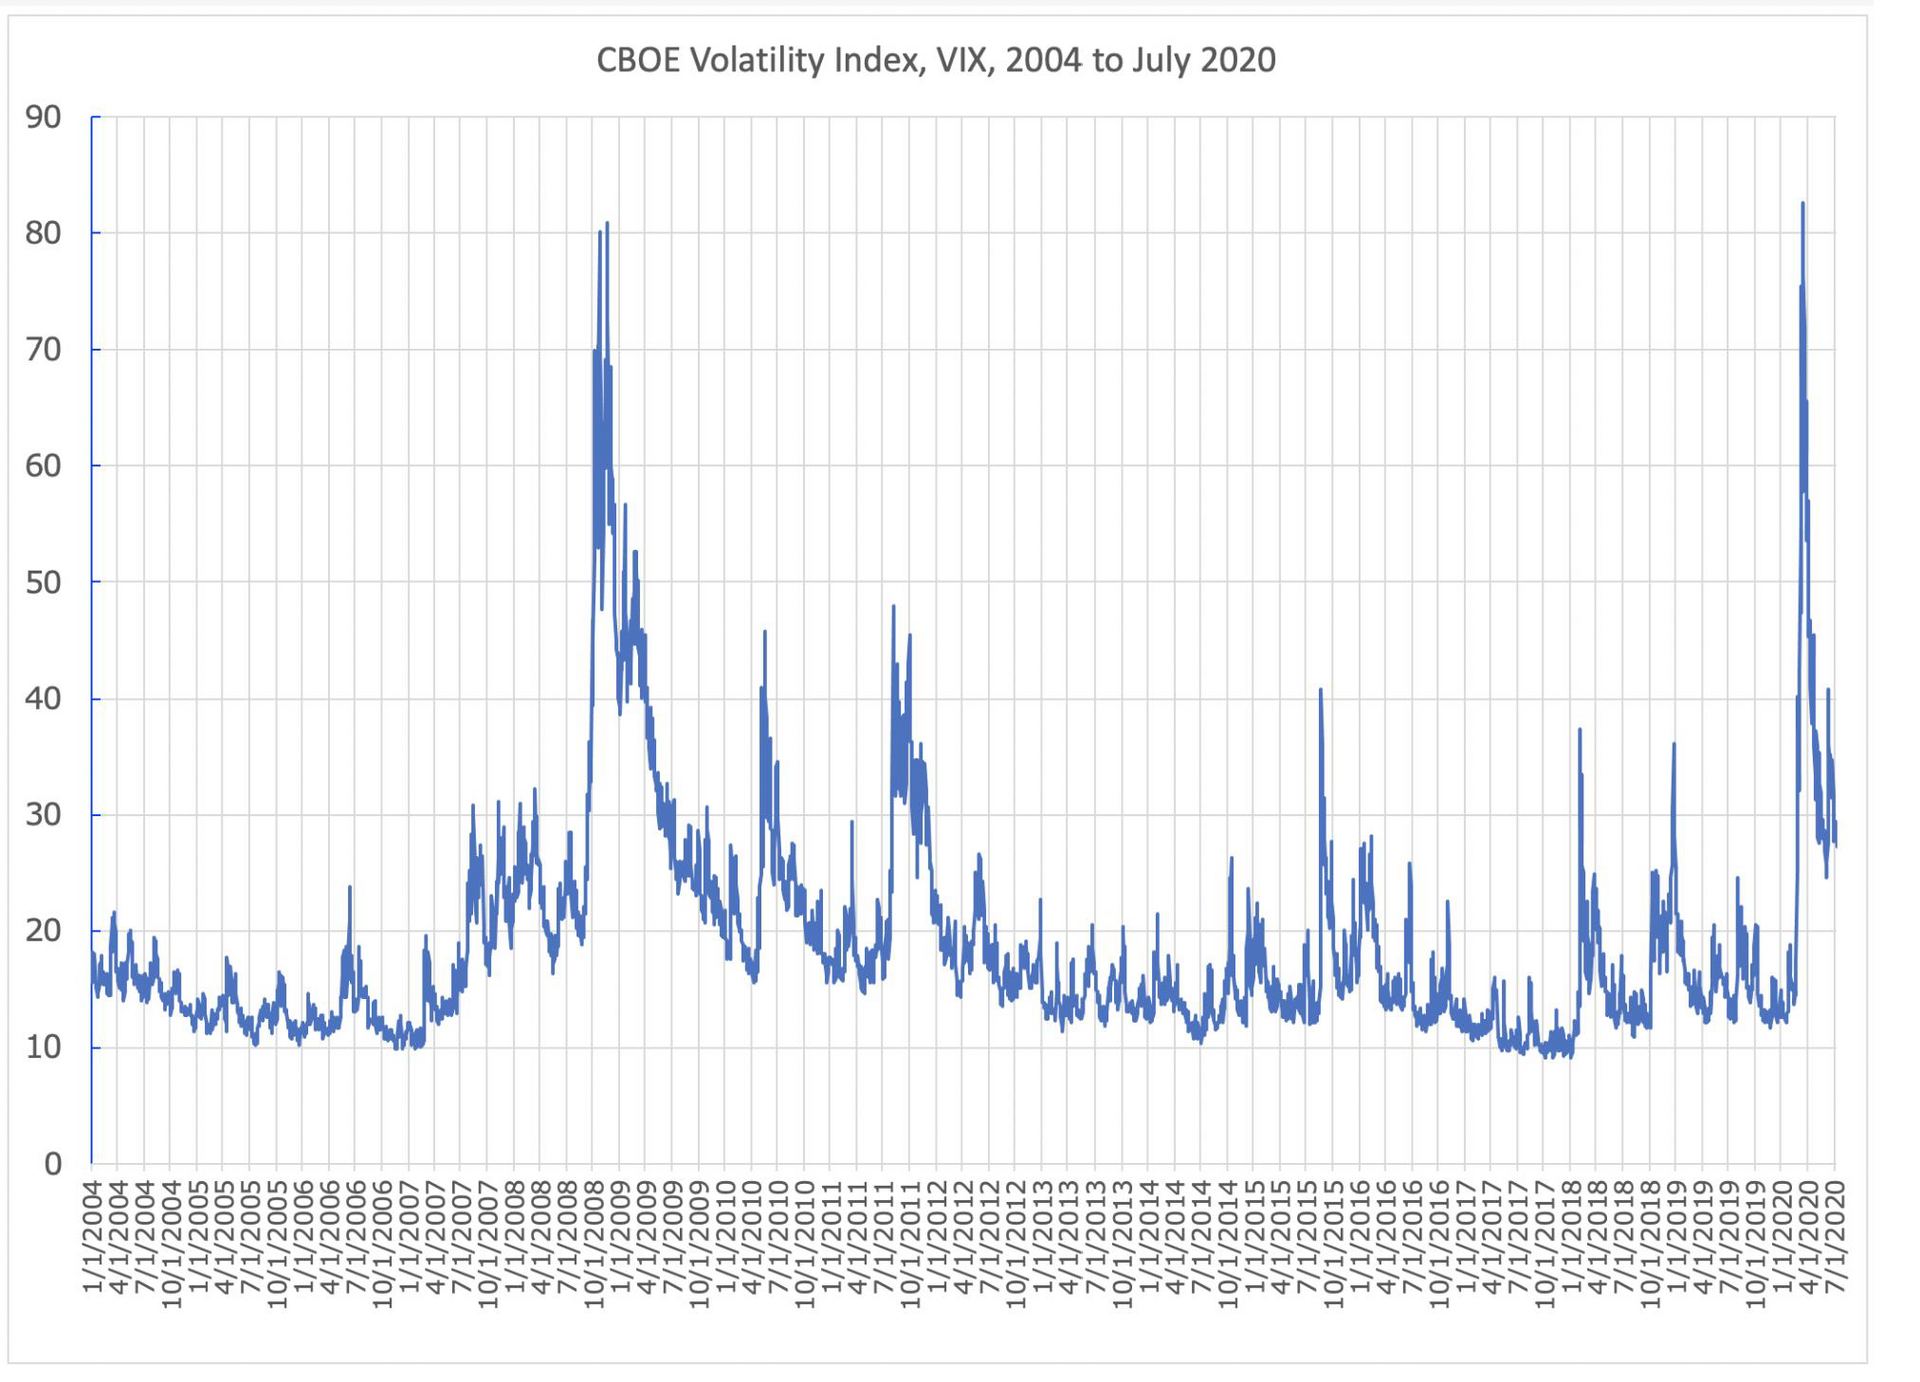
Line chart of daily VIX closes from 2004 to mid-2020, with a peak near 80 in late 2008 and another in 2020
The VIX volatility index is getting ready to knock down stock marketsInvesting

The VIX volatility index is getting ready to knock down stock markets

Rosella C.Rosella C.April 18, 2013